| .. | ||
| bin | ||
| configs | ||
| src | ||
| test | ||
| .babelrc | ||
| .eslintrc.js | ||
| index.html | ||
| initializer.js | ||
| launchpad.js | ||
| moz.build | ||
| package.json | ||
| panel.js | ||
| README.md | ||
| webpack.config.js | ||
| yarn.lock | ||
Network Monitor
The Network Monitor (netmonitor) shows you all the network requests Firefox makes (for example, when a page is loaded or when an XMLHttpRequest is performed) , how long each request takes, and details of each request. You can edit the method, query, header and resend the request as well. Read MDN to learn all the features and how to use the tool.
Prerequisite
If you want to build the Network Monitor inside of the DevTools toolbox (Firefox Devtools Panels), follow the simple Firefox build document in MDN. Start your compiled firefox and open the Firefox developer tool, you can see the Network Monitor inside.
Run inside of the DevTools toolbox
Files used to run the Network Monitor inside of the DevTools toolbox.
panel.jscalled by devtools toolbox to launch the Network Monitor panel.index.htmlpanel UI and launch scripts.src/connector/wrap function call for Browser specific API. Current support Firefox and Chrome(experimental).
Run in the browser tab (experimental)
Files used to run the Network Monitor in the browser tab
bin/files to launch test server.configs/dev configs.launchpad.jsthe entry point, equivalent toindex.html.webpack.config.jsthe webpack config file, including plenty of module alias map to shims and polyfills.package.jsondeclare every required packages and available commands.
To run in the browser tab, the Network Monitor needs to get some dependencies from npm module. Check package.json to see all dependencies. Check webpack.config.js to find the module alias, and check devtools-core packages to dive into actual modules used by the Network Monitor and other Devtools.
UI
The Network Monitor UI is built using React components (in src/components/).
- MonitorPanel in
MonitorPanel.jsis the root element. - Three major container components are
- Toolbar Panel related functions.
- RequestList Show each request information.
- NetworkDetailsPanel Show detailed information per request.
- StatusBar Show statistics while loading.
src/assetsStyles that affect the Network Monitor panel.
We prefer stateless component (define by function) instead of stateful component (define by class) unless the component has to maintain its internal state.
State
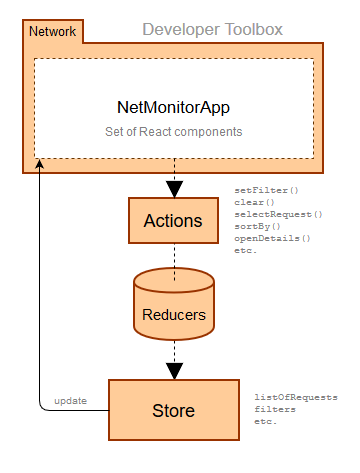
Besides the UI, the Network Monitor manages the app state via Redux. The following locations define the app state:
src/constants.jsconstants used across the tool including action and event names.src/actions/for all actions that change the state.src/reducers/for all reducers that change the state.src/selectors/functions that return a formatted version of parts of the app state.
We use reselect library to perform state calculations efficiently.