- Removes the duplicate dropdown arrow icon that is used in both RDM and Network monitor - Converts the network throttling menu in the network monitor to be a shared component that can be used in both RDM and network monitor - Move the common styles for the dropdown menu button into toolbars.css --HG-- rename : devtools/client/shared/components/throttling/NetworkThrottlingSelector.js => devtools/client/shared/components/throttling/NetworkThrottlingMenu.js |
||
|---|---|---|
| .. | ||
| bin | ||
| configs | ||
| src | ||
| test | ||
| .babelrc | ||
| .eslintrc.js | ||
| index.html | ||
| initializer.js | ||
| launchpad.js | ||
| moz.build | ||
| package.json | ||
| panel.js | ||
| README.md | ||
| webpack.config.js | ||
| yarn.lock | ||
Network Monitor
The Network Monitor (netmonitor) shows you all the network requests Firefox makes (for example, when a page is loaded or when an XMLHttpRequest is performed) , how long each request takes, and details of each request. You can edit the method, query, header and resend the request as well. Read MDN to learn all the features and how to use the tool.
Prerequisite
If you want to build the Network Monitor inside of the DevTools toolbox (Firefox Devtools Panels), follow the simple Firefox build document in MDN. Start your compiled firefox and open the Firefox developer tool, you can see the Network Monitor inside.
If you would like to run the Network Monitor in the browser tab (experimental), you need following packages:
- node >= 6.9.x JavaScript runtime.
- yarn >= 0.21.x the package dependency management tool.
- Firefox any version or build from the source code.
Quick Setup
Navigate to the mozilla-central/devtools/client/netmonitor folder with your terminal.
Note that this folder is available after mozilla-central was cloned in order to get a local copy of the repository. Then run the following commands:
# Install packages
yarn install

# Create a dev server instance for hosting netmonitor on browser
yarn start

# Run firefox
firefox http://localhost:8000 --start-debugger-server 6080
Then open localhost:8000 in any browser to see all tabs in Firefox.
More detailed setup
Instead of running command to open a new Firefox window like
firefox http://localhost:8000 --start-debugger-server 6080
If you have an opened Firefox browser, you can manually configure Firefox via type about:config in Firefox URL field, grant the warning to access preferences. And set these two preferences:
- disable
devtools.debugger.prompt-connectionto remove the connection prompt. - enable
devtools.debugger.remote-enabledto allow remote debugging a browser tab via the Mozilla remote debugging protocol (RDP)
Go to the Web Developer menu in Firefox and select Developer Toolbar. Run the command
listen 6080 mozilla-rdp
The command will make Firefox act as a remote debugging server.
Run the command
yarn start
Then open localhost:8000 in any browser to see all tabs in Firefox.
How it works
The Network Monitor uses webpack and several packages from devtools-core to run the Network Monitor as a normal web page. The Network Monitor uses Mozilla remote debugging protocol to fetch result and execute commands from Firefox browser.
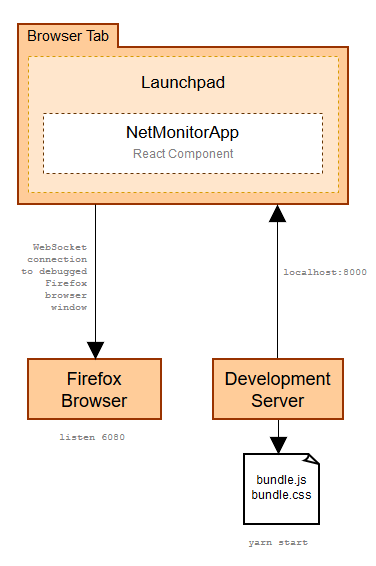
Open localhost:8000 in any browser to see the launchpad interface. Devtools Launchpad will communicate with Firefox (the remote debugging server) and list all opened tabs from Firefox. Click one of the browser tab entry, now you can see the Network Monitor runs in a browser tab.
Develop with related modules
When working on make the Network Monitor running in the browser tab, you may need to work on external modules. Besides the third party modules, here are modules required for the Network Monitor and is hosted under devtools-html (modules shared across Devtools):
- devtools-config config used in dev server
- devtools-launchpad provide the dev server, landing page and the bootstrap functions to run devtools in the browser tab.
- devtools-modules Devtools shared and shim modules.
- devtools-source-editor Source Editor component.
- devtools-reps remote object formatter for variables representation.
Do yarn link modules in related module directory, then do yarn link [module-name] after yarn install modules.
Code Structure
Top level files are used to launch the Network Monitor inside of the DevTools toolbox or run in the browser tab (experimental). The Network Monitor source is mainly located in the src/ folder, the same code base is used to run in both environments.
We prefer use web standard API instead of FIrefox specific API, to make the Network Monitor can be opened in any browser tab.
Run inside of the DevTools toolbox
Files used to run the Network Monitor inside of the DevTools toolbox.
panel.jscalled by devtools toolbox to launch the Network Monitor panel.index.htmlpanel UI and launch scripts.src/connector/wrap function call for Browser specific API. Current support Firefox and Chrome(experimental).
Run in the browser tab (experimental)
Files used to run the Network Monitor in the browser tab
bin/files to launch test server.configs/dev configs.launchpad.jsthe entry point, equivalent toindex.html.webpack.config.jsthe webpack config file, including plenty of module alias map to shims and polyfills.package.jsondeclare every required packages and available commands.
To run in the browser tab, the Network Monitor needs to get some dependencies from npm module. Check package.json to see all dependencies. Check webpack.config.js to find the module alias, and check devtools-core packages to dive into actual modules used by the Network Monitor and other Devtools.
UI
The Network Monitor UI is built using React components (in src/components/).
- MonitorPanel in
MonitorPanel.jsis the root element. - Three major container components are
- Toolbar Panel related functions.
- RequestList Show each request information.
- NetworkDetailsPanel Show detailed information per request.
- StatusBar Show statistics while loading.
src/assetsStyles that affect the Network Monitor panel.
We prefer stateless component (define by function) instead of stateful component (define by class) unless the component has to maintain its internal state.
State
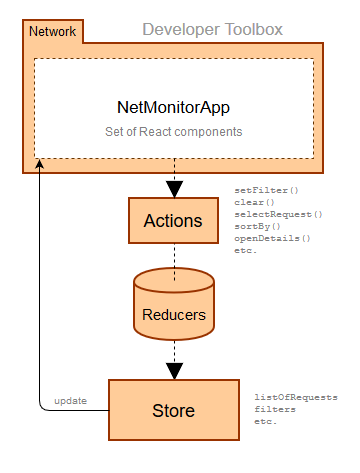
Besides the UI, the Network Monitor manages the app state via Redux. The following locations define the app state:
src/constants.jsconstants used across the tool including action and event names.src/actions/for all actions that change the state.src/reducers/for all reducers that change the state.src/selectors/functions that return a formatted version of parts of the app state.
We use reselect library to perform state calculations efficiently.