|
|
||
|---|---|---|
| .. | ||
| examples | ||
| screenshots | ||
| src | ||
| .cargo-checksum.json | ||
| Cargo.lock | ||
| Cargo.toml | ||
| CHANGELOG.md | ||
| deny.toml | ||
| LICENSE-APACHE | ||
| LICENSE-MIT | ||
| README.md | ||
| rustfmt.toml | ||
profiling
Provides a very thin abstraction over instrumented profiling crates like puffin, optick, tracy, and superluminal-perf.
Mark up your code like this:
#[profiling::function]
fn some_function() {
    burn_time(5);

    for i in 0..5 {
        profiling::scope!("Looped Operation");
    }
}
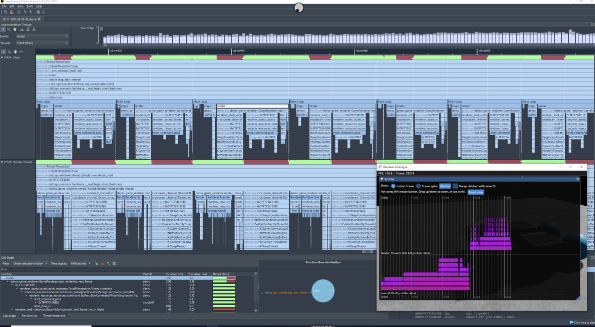
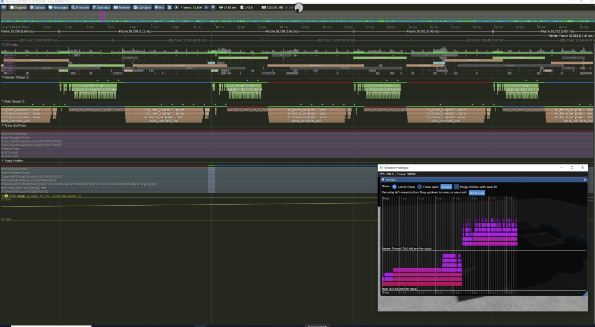
See below for resulting visualization and more details on the exposed API.
Friendly Warning: Some profiler backends implicitly listen on network ports immediately when the host app is launched. If this is a concern, please review the enabled profiler(s) documentation for details!
Puffin
- https://github.com/EmbarkStudios/puffin
- Cross-platform
- Unlike the other backends,
puffinrelies on your app providing an imgui window to draw the UI in-process. The below screenshots have a profiled application open with the puffin imgui window visible.
Optick
- https://github.com/bombomby/optick
- The upstream crate only provides binaries for windows. However it could probably be made to work by building optick capture code and linking against it manually. The UI is windows only.
Superluminal
- https://superluminal.eu
- Windows only
Tracing
- https://crates.io/crates/tracing
- Cross-platform
- The tracing backend injects tracing
span!()macros that match the lifetime of the profiling macros. Tracing uses callbacks rather than inlining specific pre-determined code, so it is more flexible than profiling (at the cost of more lines of code and potentially higher overhead). This allows existing and new tracing-compatible handlers to work with profiling.
Tracy
- https://github.com/wolfpld/tracy
- Cross-platform (windows, macOS, linux)
Usage
Currently, there's just four macros:
profiling::scope!(name: &str, [tag: &str])- name: scopes will appear in the profiler under this name
- tag: optional extra data
#[profiling::function]- procmacro placed on a function to quickly wrap it in a scope using the function name
profiling::register_thread!([name: &str])- name: optional, defaults to
std::thread::current().name, or.idif it's unnamed
- name: optional, defaults to
profiling::finish_frame!()- Many profilers have the concept of a "frame" as a unit of work. Use this to indicate where one frame ends and the next one begins.
Support for individual profilers can be turned on/off with feature flags. By default, they're all off, resulting in no dependencies or runtime code.
Who is this for?
- Authors of binaries that want to have multiple options for profiling their code, but don't want to duplicate their instrumentation once per each profiler's individual API.
- Authors of libraries that would like to instrument their crate for their end-users.
This crate is intended to be TINY. It won't support every possible usage, just the basics. I'm open to adding more things but I plan to be very selective to maintain a slim size.
When enabled, using a macro produces identical code as if you used the wrapped profiling API directly. So it is completely fine to directly use a profiler's API when this abstraction doesn't support something you want to do.
Alternatives
tracing: tracing is more flexible than profiling but is significantly larger and has
some potential runtime cost. profiling is only useful for instrumented profiling. Instrumentation is inserted directly
into your code inline via macros as if you were using the profiler's crate directly. This results in smaller code with
no additional overhead.
Using profiling crates (i.e. puffin/optick/etc.) directly:
- For authors of binaries, you may still need to use APIs on those crates to get started. But when instrumenting your
code,
profiling::scope!("Scope Name")inside a function or#[profiling::function]on a function will instrument it for all the supported profiler-specific crates. You can still use those crates directly if you want to take advantage of custom APIs they provide to surface additional data. - For authors of upstream libraries, this crate lets you implement simple instrumentation once. Hopefully this will allow the community to benefit from instrumented profiling, even if a significant amount of a codebase is made of upstream crates.
Using from a Binary
It's up to you to initialize the profiling crate of your choice (although some do not need explicit initialization
and will immediately work). The examples demonstrate this for all the supported crates, but it's worth looking
at the docs for the profiler you're interested in using! profiling re-exports the profiler crates if they are
enabled, simplifying the modifications you would need to make to your Cargo.toml.
Once initialized, you can mix/match the macros provided by your profiler of choice and the generic ones in this crate. For example:
// This may map to something like:
// - puffin::profile_scope!("Scope Name")
// - optick::event!("Scope Name")
// - tracing::span!(tracing::Level::INFO, "Scope Name")
// - superluminal_perf::begin_event("Scope Name")
profiling::scope!("Scope Name");

// This may map to something like:
// - puffin::profile_scope_data!("Scope Name", "extra data")
// - optick::event!("Scope Name"); optick::tag!("tag", "extra data");
// - tracing::span!(tracing::Level::INFO, "Scope Name", tag = "extra data")
// - superluminal_perf::begin_event_with_data("Scope Name", "extra data", 0)
profiling::scope!("Scope Name", "extra data");
There is also a proc macro to decorate functions:
#[profiling::function]
fn my_function() {

}
Take a look at the code for the helpful macros register_thread!() and finish_frame!().
I recommend adding features for each backend you want to use to your binary crate. This allows you to optionally compile in code to setup and configure a backend.
[dependencies]
profiling = "1.0"

[features]
profile-with-puffin = ["profiling/profile-with-puffin"]
profile-with-optick = ["profiling/profile-with-optick"]
profile-with-superluminal = ["profiling/profile-with-superluminal"]
profile-with-tracing = ["profiling/profile-with-tracing"]
profile-with-tracy = ["profiling/profile-with-tracy"]
- You can use the default feature to quickly/temporarily turn something on:
default = ["profile-with-optick"] cargo run --features=profile-with-optickworks too!
Using from a Library
Add the profiling crate to Cargo.toml:
[dependencies]
profiling = "1.0"
Now you can instrument your library using the API exposed via the profiling crate.
If the end-user of your library doesn't use profiling, the macros in this crate will emit no code at all.
Feature Flags
- profile-with-puffin: Enable the
puffincrate - profile-with-optick: Enable the
optickcrate - profile-with-superluminal: Enable the
superluminal-perfcrate - profile-with-tracing: Enable the
tracingcrate. (This is just an abstraction layer - you'd want to hook it to do something!) - profile-with-tracy: Enable the
tracy-clientcrate.
Only one backend can be enabled at a time!
Examples
- simple: Shows a bare minimum requirements to do some simple instrumented profiling. Once it's running, you can connect to the process using optick/tracy/superluminal. Some of these are windows only!
run --example simple --features="profile-with-optick"
run --example simple --features="profile-with-tracy"
run --example simple --features="profile-with-puffin"
run --example simple --features="profile-with-superluminal"
- puffin: Launches a basic app with imgui integration showing the puffin UI. This one should run everywhere that supports imgui.
cargo run --example puffin --features="profile-with-puffin"
License
Licensed under either of
- Apache License, Version 2.0, (LICENSE-APACHE or http://www.apache.org/licenses/LICENSE-2.0)
- MIT license (LICENSE-MIT or http://opensource.org/licenses/MIT)
at your option.
The examples directory contains NotoSans-Medium.ttf, available under SIL Open Font
License (OFL).
Contribution
Unless you explicitly state otherwise, any contribution intentionally submitted for inclusion in the work by you, as defined in the Apache-2.0 license, shall be dual licensed as above, without any additional terms or conditions.
See LICENSE-APACHE and LICENSE-MIT.


