|
|
||
|---|---|---|
| demo | ||
| etc | ||
| figures | ||
| include | ||
| interfaces | ||
| proto | ||
| script | ||
| src | ||
| test | ||
| .clang-format | ||
| .gitignore | ||
| BUILD.gn | ||
| bundle.json | ||
| clang_format_all.bat | ||
| clang_format_all.sh | ||
| hiperf.gni | ||
| LICENSE | ||
| OAT.xml | ||
| README_zh.md | ||
| README.md | ||
hiperf
Introduction
hiperf is a command-line debugging tool provided by OpenHarmony for developers. It can capture performance data of a specific program or the entire system, like the kernel's perf tool. hiperf can run on Windows, Linux, and macOS.
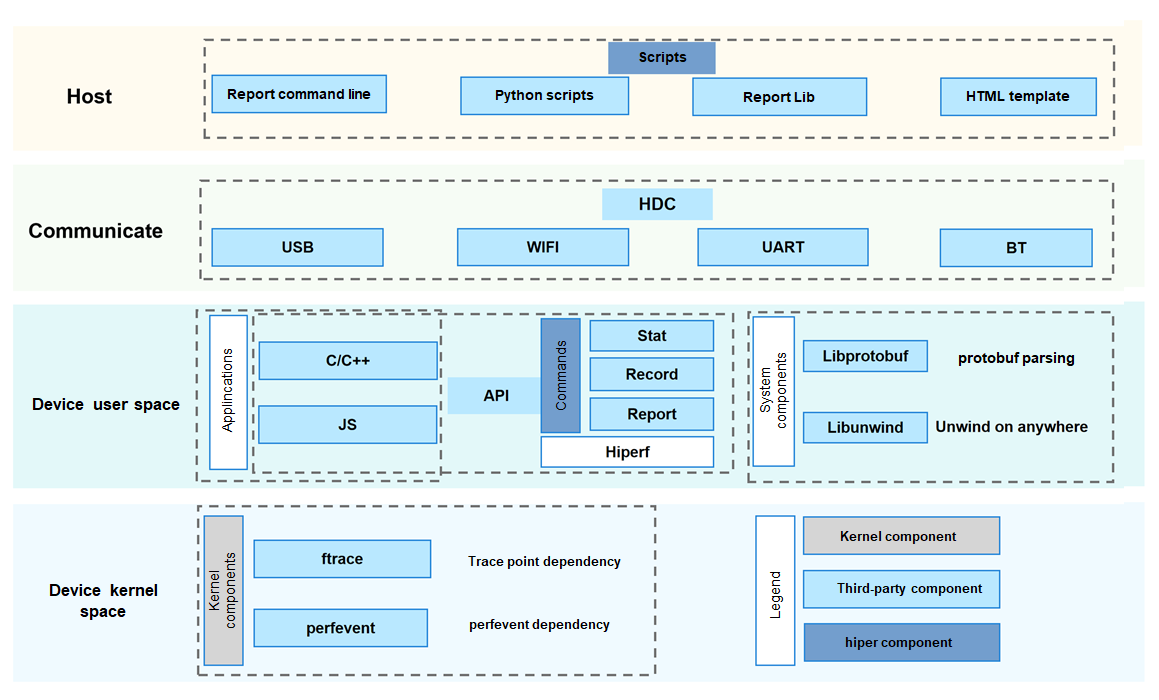
Architecture
Directory Structure
/developtools/hiperf
├── demo			# Demo program
│   ├── cpp			# C++ demo program, which demonstrates how to call APIs to simulate sampling scenarios.
│   └── js			# JS demo program, which demonstrates how to call APIs.
├── include			# Project header files.
│   └── nonlinux	# Header file for cross compilation (non-Linux platform)
├── interfaces		# APIs
│   ├── innerkits	# C++ APIs.
│   └── kits		# JS APIs
├── proto		    # Definition of the data structure exported to proto by the report command
├── script			# Host scripts, including HTML
│   └── test		# Unit test of the script
├── src				# Source code
└── test			# Unit test of the source code
Constraints
hiperf must be used with Python 3.7.0 or later.
| Dependency | Version |
|---|---|
| Python | 3.7.0 |
Building
Basic Settings
- Ensure that the hiperf component name is in the JSON file of the Product Definition.
- Product Definition
- Add
"developtools:hiperf":{}.
- Add
- Product Definition
Build Commands
| Description | Parameter |
|---|---|
| Build only the binary executable files of the current device platform. | --build-target hiperf_target |
| Build all components (including unit tests) of all platforms. | --build-target hiperf_all |
| Build the tool for x86_64 Linux. | --gn-args "hiperf_target_host=true" |
| Build the unit test. | --build-target hiperf_unittest |
| Build the unit test interface (command line). | --build-target hiperf_interfacetest |
Output
| Build Target | Running Platform | File Location | File Name |
|---|---|---|---|
| Dev command-line program | arm | out\ohos-arm-release\developtools\hiperf\hiperf | hiperf |
| linux | out\ohos-arm-release\clang_x64\developtools\hiperf | hiperf | |
| Host command-line program | Linux | out\ohos-arm-release\clang_x64\developtools\hiperf | hiperf_host |
| Windows | out\ohos-arm-release\mingw_x86_64\developtools\hiperf | hiperf_host.exe | |
| Dynamic library of the host | Linux | out\ohos-arm-release\clang_x64\developtools\hiperf | libhiperf_report.so |
| Windows | out\ohos-arm-release\mingw_x86_64\developtools\hiperf | libhiperf_report.dll |
You can also run developtools/hiperf/script/package.sh after the build to package the files to the out folder.
host/
└── developtools
    ├── hiperf
    │   ├── bin								  # All binary files
    │   │   ├── linux						   # Linux platform
    │   │   │   └── x86_64
    │   │   │       ├── hiperf_host				# Executable program run by the PC. The Report and Dump commands are supported.
    │   │   │       └── libhiperf_report.so		# Lib file run by the PC. It is used by the Python script.
    │   │   ├── ohos
    │   │   │   └── arm						   # Arm platform
    │   │   │       └── hiperf				    # Executable program run by the board
    │   │   └── windows						   # Windows
    │   │       └── x86_64
    │   │           ├── hiperf_host.exe			# Executable program run by the PC
    │   │           └── libhiperf_report.dll	# Lib file run by the PC
    │   │
    │   │									  # Python files run by the PC
    │   ├── command_script.py					# Script of the hiperf commands, used to generate sampling data
    │   ├── hiperf_utils.py						# Utility class of hiperf
    │   ├── loadlib_test.py						# Lib test script
    │   ├── make_diff.py						# Script used to generate Diff data
    │   ├── make_report.py						# Script used to generate a report from the sampled data
    │   ├── recv_binary_cache.py				# Script used to collect the symbol table
    │   └── report.html						    # Template of the HTML display page
    └── hiperf.tar.gz						    # Package of the preceding files
hiperf with Debug Symbols
Find exe.unstripped and lib.unstripped in the out directory. For example:
out\ohos-arm-release\clang_x64\exe.unstripped\clang_x64\developtools\hiperf
Usage
Test Code
Test code is provided in hiperf_example_cmd.cpp to verify sampling functions of thread scheduling, memory allocation, and CPU load.
The code is located in:
hiperf\demo\cpp\hiperf_example_cmd.cpp
Help information about the test command:
 ./hiperf_example_cmd --help
this is a demo test command
  Use the following commands to simulate different scenarios
  --help
    this page
  --thread <number>
    setup the thread number, default is 5 second
  --time <time>
    setup run sec, default is 10 second
  --stack <level>
    setup stack level, default is 5
  --nowait
    setup skip the start, default wait the start
  --dynamic
    will run some code in each stack level
  --mmap
    will run mmap code in the loop
Main Command Format
hiperf [options] COMMAND [args for command]
- [options]
- Optional parameter.
- Debugging commands, such as enabling the logging function.
- COMMAND
- Mandatory parameter.
- Name of a sub-function, for example, record or report.
- [args for command]
- Parameters of the sub-function
help
You can run the --help command to view help information.
--help [command]

[command] --help
Both formats are supported.
Parameters
| Parameter | Description |
|---|---|
| --help [command] | Displays the help information about the specified function. |
| --debug | Enables the debug logs of the DEBUG level. |
| --verbose | Enables the debug logs of the VERBOSE level. |
| --much | Enables the debug logs of the MUCH level. |
| --mixlog | Displays mixed debug logs to the screen (stdout). |
| --logtag <tagA [,tagB] [,tagC]> | Enables the debug logs of the MUCH level for the specified module. |
| --hilog | Prints logs to Hilog. |
| --logpath | Specifies the log path. |
| --nodebug | Stops printing any logs. |
list
The list command lists all the perf events supported by the performance monitoring unit (PMU).
The event names are used for the -e and -g parameters of the stat and record commands.
Usage: hiperf list [event type name]
List the hardware events supported by the PMU. The command also lists the events that are not supported by the PMU.
./hiperf list hw
stat
The stat command monitors the specified application and periodically prints the values of performance counters.
Usage: hiperf stat [options] [command [command-args]]
       Collect performance counter information of running [command].
Monitor the performance counter of the process on CPU 0 for 3 seconds.
./hiperf stat -d 3 -c 0
record
The record command samples the specified application and saves the sampling data to a file (perf.data by default).
Usage: hiperf record [options] [command [command-args]]
       Collect performance sampling information of running [command].
Sample all processes in the system for 3 seconds and display detailed log information.
./hiperf record -d 3 -a --verbose
dump
The dump command reads the perf.data file without processing it.
You can verify the correctness of the raw sampling data.
Usage:hiperf dump [option] \<filename\>
       Dump specific parts of specified file.
report
The report command displays the sampling data (read from perf.data) and converts it to the required format (for example, JSON or ProtoBuf).
Usage: hiperf dump [option] \<filename\>
       Dump specific parts of specified file .
Output a common report, with the minimum display percentage of 1%.
./hiperf report --limit-percent 1
Scripts
Run scripts to perform sampling operations (which can easily generate HTML reports).
Sampling
Run command_script.py to sample data. This script is the packaging script of the report command.
Usage: command_script.py [-h]
                         (-app PACKAGE_NAME | -lp LOCAL_PROGRAM | -cmd CMD | -p [PID [PID ...]] | -t [TID [TID ...]] | -sw)
                         [-a ABILITY] [-r RECORD_OPTIONS] [-lib LOCAL_LIB_DIR]
                         [-o OUTPUT_PERF_DATA] [--not_hdc_root]

Collect performance sampling information of running [command].
Sample the com.ohos.launch package.
python command_script.py -app com.ohos.launch
Sample the hdcd process.
python command_script.py -lp hdcd
Collecting Symbol Tables
Run recv_binary_cache.py to collect symbol tables. The tool searches for the ELF in the specified paths based on the related files and libraries recorded in perf.data and their buildids.
Usage: recv_binary_cache.py [-h] [-i PERF_DATA]
                            [-l LOCAL_LIB_DIR [LOCAL_LIB_DIR ...]]

Recv binaries needed by perf.data from device to binary_cache directory.
The following specifies two symbol table paths.
python recv_binary_cache.py -l Z:\OHOS_MASTER\out\ohos-arm-release\lib.unstripped Z:\OHOS_MASTER\out\ohos-arm-release\exe.unstripped
The symbol table files will be copied to the binary_cache folder.
The tool preferentially searches for the specified symbol table paths. If no path is specified, the tool copies the files in the device.
Displaying Sampled Data
Run make_report.py to display the sampled data in an HTML page.
Usage: make_report.py [-h] [-i PERF_DATA] [-r REPORT_HTML]

To make a report, you need to enter the data source and the path of the
report.
An HTML file is generated. The default file name is hiperf_report.html.
python make_report.py
- Displaying the home page
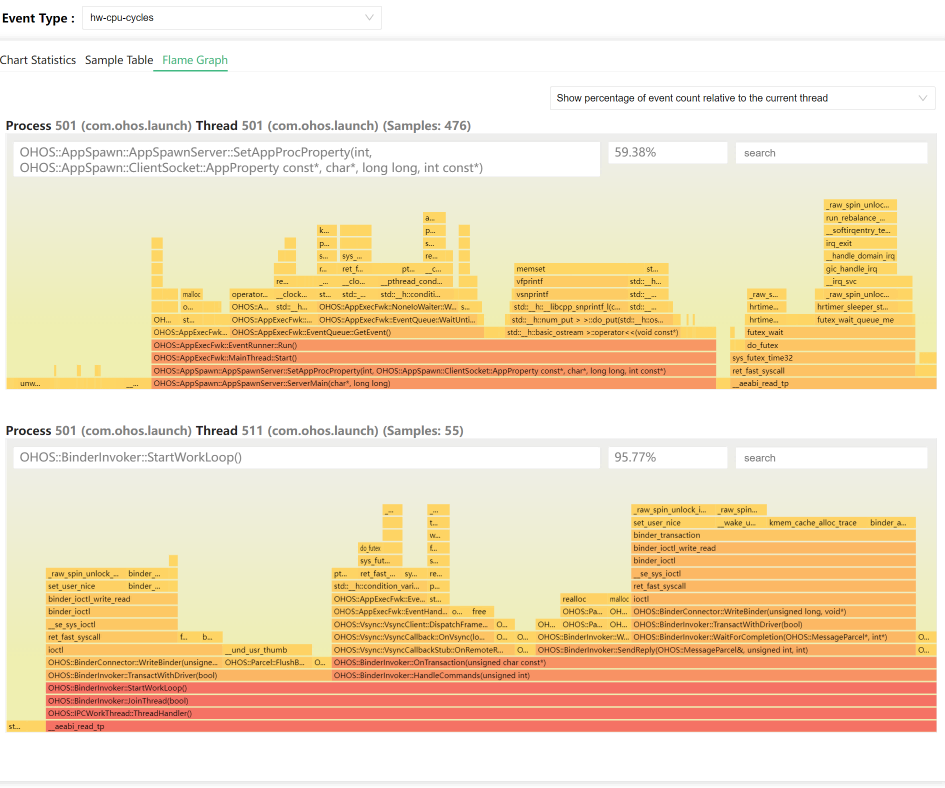
- Displaying the flame graph.
Troubleshooting
Can't find hdc_std in PATH environment.
python command_script.py -lp ps
['../..\\..\\platform-tools\\hdc', 'version']
['hdc', 'version']
Traceback (most recent call last):
  File "command_script.py", line 367, in <module>
    main(parser_add_argument())
  File "command_script.py", line 361, in main
    profiler = PerformanceProfile(args)
  File "command_script.py", line 143, in __init__
    self.hdc = HdcInterface(root_authority=not args.not_hdc_root)
  File "Z:\OHOS_MASTER\out\host\developtools\hiperf\hiperf_utils.py", line 173, in __init__
    raise Exception("Can't find hdc in PATH environment.")
Exception: Can't find hdc_std in PATH environment.
Check whether the PATH environment variable contains the hdc executable file.
Run the following commands:
where hdc_std
Z:\OHOS_MASTER\developtools\hdc_standard\prebuilt\windows\hdc_std.exe
Z:\OHOS_STD_2.0\developtools\hdc_standard\prebuilt\windows\hdc_std.exe
Repositories Involved
Development Toolchain Subsystem
developtools\developtools_profiler


