---
title: How to set up embedded analytics
date: 2025-08-29
author:
- ian-vanagas
tags:
- insights
- product analytics
- sql
---
If you're building a B2B2C product, *your users* might want analytics about *their users*. You can provide this with embedded analytics (AKA customer-facing analytics), events you capture and then display for them.
This tutorial shows you how to set up embedded analytics by creating a basic Next.js app with PostHog, querying analytics data via PostHog's [queries API](/docs/api/queries), and then displaying it with Recharts.
> **Note:** In this tutorial, we include a `name` parameter with each query. This makes it easier to identify and debug queries in the [query log](/docs/data/query-log), which is especially useful when building customer-facing analytics.
## Creating a Next.js app
First, ensure [Node.js is installed](https://nodejs.dev/en/learn/how-to-install-nodejs/) (version 18.0 or newer) then run the following to create a new Next.js app. Say **yes** to TypeScript, **yes** to Tailwind, **yes** to app router, and the defaults for all the other options.
```bash
npx create-next-app@latest embedded-analytics
```
We’ll then update `page.tsx` to an input to select between two “teams” and a button. We’ll use this to capture data later.
```ts
// app/page.tsx
'use client'
import { useState } from 'react'
export default function Home() {
const [team, setTeam] = useState('blue')
return (
Welcome to the app
);
}
```
## Setting up PostHog
To capture analytics for our app, start by installing `posthog-js`:
```bash
npm i posthog-js
```
Afterwards, create an `instrumentation-client.ts` file at the base of your project and set up a PostHog initialization in it using your project API key and host from [your project settings](http://app.posthog.com/settings/project).
```ts
// instrumentation-client.ts
import posthog from 'posthog-js'
posthog.init('', {
api_host: '',
defaults: '',
});
```
To use it, import PostHog in `page.tsx` and capture a `home_button_clicked` event like this:
```ts
// app/page.tsx
'use client'
import { useState } from 'react'
import posthog from 'posthog-js' // +
export default function Home() {
const [team, setTeam] = useState('blue')
return (
Welcome to the app
);
}
```
You can then run `npm run dev` to see the app in action. PostHog will autocapture events and clicking the button will capture a `home_button_clicked` event with a team property.
## Querying data from PostHog for our embedded analytics
Now that we have data being captured, we can set up our queries to get this data from PostHog. We’ll create two:
1. A trend of pageviews
2. A count of button clicks that depends on each team
This starts by creating API routes in our app to make both PostHog queries. In our `app` folder, we’ll create a new `api` folder, then create `pageviews` and `button-clicks` folders inside that, and then a `route.ts` file inside each of those.
### Setting up our pageviews query
In `/api/pageviews/route.ts`, we start by setting our host URL and project ID, both of which you can get from the URL of your PostHog instance.
It also requires a personal API key with project **query read** permissions. You can set this up in [your user settings](https://app.posthog.com/settings/user-api-keys).
We then use these to set up a request to PostHog’s `query` endpoint with an SQL query to get pageviews for the last 7 days. Together, this looks like this:
```ts
// app/api/pageviews/route.ts
import { NextRequest, NextResponse } from 'next/server';
export async function POST(request: NextRequest) {
const posthogUrl = "https://us.posthog.com" // or eu...
const projectId = "5...."
const personalApiKey = "phx_1..."
try {
const url = `${posthogUrl}/api/projects/${projectId}/query/`;
const response = await fetch(url, {
method: 'POST',
headers: {
'Content-Type': 'application/json',
'Authorization': `Bearer ${personalApiKey}`
},
body: JSON.stringify({
query: {
kind: 'HogQLQuery',
query: `
SELECT
toDate(timestamp) AS date,
count() AS pageviews
FROM events
WHERE
event = '$pageview'
GROUP BY date
ORDER BY date DESC
LIMIT 7
`
},
name: 'embedded_analytics_pageviews'
}),
});
if (!response.ok) {
const errorText = await response.text();
return NextResponse.json(
{ error: `PostHog API error: ${errorText}` },
{ status: response.status }
);
}
const data = await response.json();
return NextResponse.json(data.results);
} catch (error) {
console.error('Error processing pageviews request:', error);
return NextResponse.json(
{ error: 'Internal server error' },
{ status: 500 }
);
}
}
```
### Setting up our button clicks query
In `/api/button-clicks/route.ts`, we’ll add a similar API request to get button clicks. The difference is that it takes a variable for the team we use to get the button clicks for that specific team.
```ts
// app/api/button-clicks/route.ts
import { NextRequest, NextResponse } from 'next/server';
export async function POST(request: NextRequest) {
const posthogUrl = "https://us.posthog.com" // or eu...
const projectId = "5...."
const personalApiKey = "phx_1..."
try {
const url = `${posthogUrl}/api/projects/${projectId}/query/`;
const body = await request.json();
// Make sure to sanitize this value in a real implementation
const team = body.team;
const response = await fetch(url, {
method: 'POST',
headers: {
'Content-Type': 'application/json',
'Authorization': `Bearer ${personalApiKey}`
},
body: JSON.stringify({
query: {
kind: 'HogQLQuery',
query: `
select count()
from events
where
event = 'home_button_clicked'
AND toDate(timestamp) = today()
AND properties.team = '${team}'
`
},
name: `embedded_analytics_button_clicks`
}),
});
if (!response.ok) {
const errorText = await response.text();
return NextResponse.json(
{ error: `PostHog API error: ${errorText}` },
{ status: response.status }
);
}
const data = await response.json();
return NextResponse.json(data.results);
} catch (error) {
console.error('Error processing pageviews request:', error);
return NextResponse.json(
{ error: 'Internal server error' },
{ status: 500 }
);
}
}
```
### Triggering analytics queries
The last piece here is triggering these queries and showing the data to the frontend.
To do this, we will create a new `analytics` folder inside the `app` directory. In it, we’ll create a `page.tsx` file. This page makes requests to both the `/api/pageviews` and `/api/button-click` routes and displays the returned data.
It also formats the pageview data for use in a trend and lets people choose between `red` and `blue` team button click stats. Altogether, this looks like this:
```ts
// app/analytics/page.tsx
'use client'
import React, { useState, useEffect } from 'react';
export default function AnalyticsPage() {
const [pageviews, setPageviews] = useState>([]);
const [buttonClicks, setButtonClicks] = useState('');
const [team, setTeam] = useState('blue');
const fetchPageviews = async () => {
try {
const res = await fetch('/api/pageviews', {
method: 'POST',
headers: {
'Content-Type': 'application/json',
}
})
const response = await res.json();
const formattedData = response.map(([date, views]: [string, number]) => ({
date,
views
}));
setPageviews(formattedData);
} catch (error: any) {
console.error('Error fetching pageviews:', error);
setPageviews([]);
}
};
const fetchButtonClicks = async (team: string) => {
try {
setButtonClicks('Getting button clicks...');
const res = await fetch('/api/button-clicks', {
method: 'POST',
headers: {
'Content-Type': 'application/json',
},
body: JSON.stringify({ team: team }),
})
const response = await res.json();
setButtonClicks(response);
} catch (error: any) {
setButtonClicks(error.message);
}
};
const changeTeam = (e: any) => {
setTeam(e.target.value);
fetchButtonClicks(e.target.value);
}
useEffect(() => {
fetchPageviews();
fetchButtonClicks(team);
}, []);
return (
);
};
```
When we run `npm run dev` again and go to `http://localhost:3000/analytics`, we’ll see our pageview and button click data from PostHog.
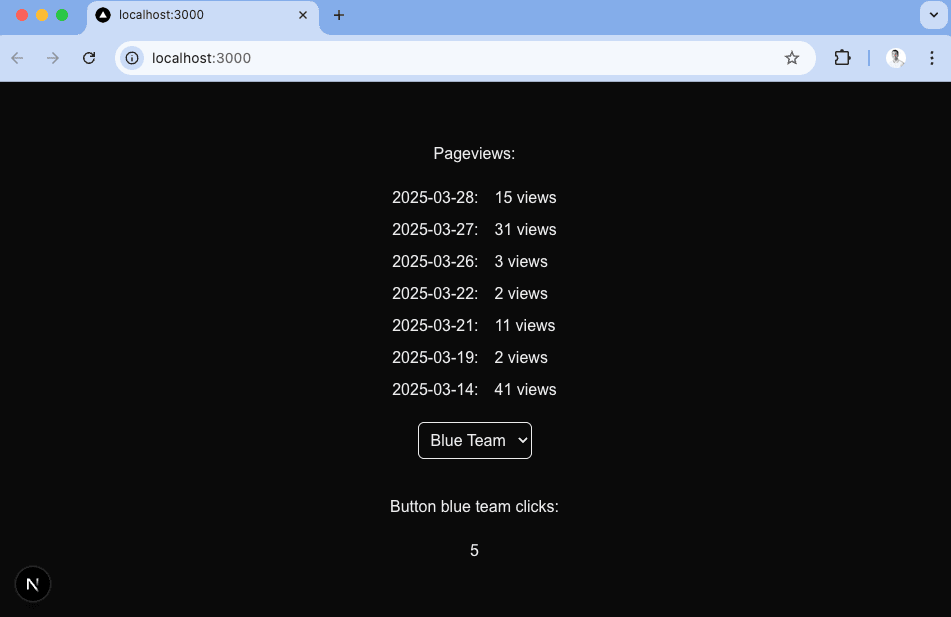
Toggling between the two team’s button clicks gives you an idea of how you can segment embedded analytics for multiple teams or users.
The next problem we need to solve: making the pageview data look better. We’ll set up better visuals in the next step with Recharts.
## Setting up Recharts to visualize PostHog data
The simplest way to visualize our data is with Recharts, but you could also use a library like shadcn or Tremor. To start with Recharts, install it:
```bash
npm i recharts
```
Next, in `app/analytics/page.tsx`, we’ll import the components needed for a line chart and set it up with our formatted pageview data like this:
```ts
// app/analytics/page.tsx
'use client'
import React, { useState, useEffect } from 'react';
import { LineChart, Line, XAxis, YAxis, Tooltip } from 'recharts'; // +
export default function AnalyticsPage() {
// ... existing code
return (
);
};
```
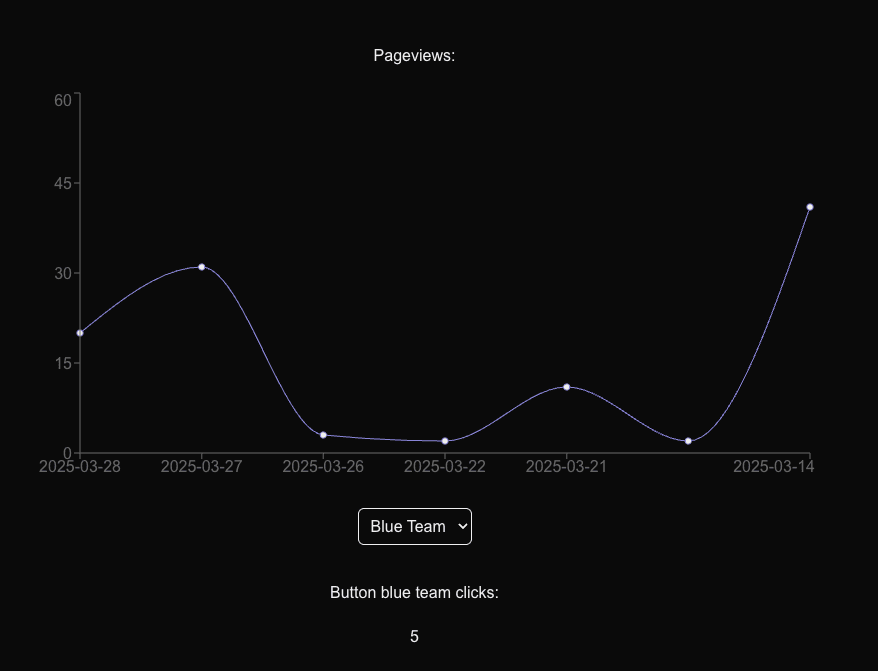
This creates a simple (and much nicer looking) final visualization for our pageview data.
## Using a materialized view to improve performance
Although these queries are simple and fast, more complex queries you add later may be slower. To improve performance and keep queries as fast as possible, you can use a [materialized view](/docs/data-warehouse/views/materialize).
We can show this off by materializing our pageview query. To do this, go to the SQL editor in PostHog and enter your pageview query:
```sql
SELECT
toDate(timestamp) AS date,
count() AS pageviews
FROM events
WHERE
event = '$pageview'
GROUP BY date
ORDER BY date DESC
LIMIT 7
```
Select the **Materialization** tab below the query and click **Save and materialize**. Give your view a name like `mat_embedded_pageviews`, press **Submit**, and then the materialization will start.
Once done, you can then use the materialized view back in your pageview API route like this:
```ts focusOnLines=18-21
import { NextRequest, NextResponse } from 'next/server';
export async function POST(request: NextRequest) {
const posthogUrl = "https://us.posthog.com" // or eu...
const projectId = "5...."
const personalApiKey = "phx_1..."
try {
const url = `${posthogUrl}/api/projects/${projectId}/query/`;
const response = await fetch(url, {
method: 'POST',
headers: {
'Content-Type': 'application/json',
'Authorization': `Bearer ${personalApiKey}`
},
body: JSON.stringify({
query: {
kind: 'HogQLQuery',
query: `SELECT * from mat_embedded_pageviews`
}
}),
});
if (!response.ok) {
const errorText = await response.text();
return NextResponse.json(
{ error: `PostHog API error: ${errorText}` },
{ status: response.status }
);
}
const data = await response.json();
return NextResponse.json(data.results);
} catch (error) {
console.error('Error processing pageviews request:', error);
return NextResponse.json(
{ error: 'Internal server error' },
{ status: 500 }
);
}
}
```
The response is the same as before but the query is faster, which helps provide a better experience for your users.
## Further reading
- [How to use Recharts to visualize analytics data (with examples)](/tutorials/recharts)
- [How to use React Charts to visualize analytics data (with examples)](/tutorials/react-charts)
- [The basics of SQL for analytics](/product-engineers/sql-for-analytics)