mirror of
https://github.com/BillyOutlast/posthog.com.git
synced 2026-02-05 20:01:20 +01:00
142 lines
5.6 KiB
Markdown
142 lines
5.6 KiB
Markdown
---
|
|
title: How to set up a React app heatmap with PostHog
|
|
date: 2025-03-07
|
|
author:
|
|
- ian-vanagas
|
|
showTitle: true
|
|
sidebar: Docs
|
|
tags:
|
|
- heatmaps
|
|
- toolbar
|
|
- product os
|
|
---
|
|
|
|
Understanding where users click your site or app shows you what interests them. A heatmap can visualize these clicks to make this analysis easier.
|
|
|
|
To help you get started, this tutorial will walk through setting up a React app with Vite, adding PostHog, accessing the heatmap, and customizing the heatmap to your needs.
|
|
|
|
## Creating a React app with Vite
|
|
|
|
First, [install Node](https://nodejs.dev/en/learn/how-to-install-nodejs/), then create a React app with Vite in your terminal, and name it whatever you want (we name ours `heatmap`).
|
|
|
|
```bash
|
|
npm create vite@latest heatmap -- --template react
|
|
cd heatmap
|
|
npm install
|
|
```
|
|
|
|
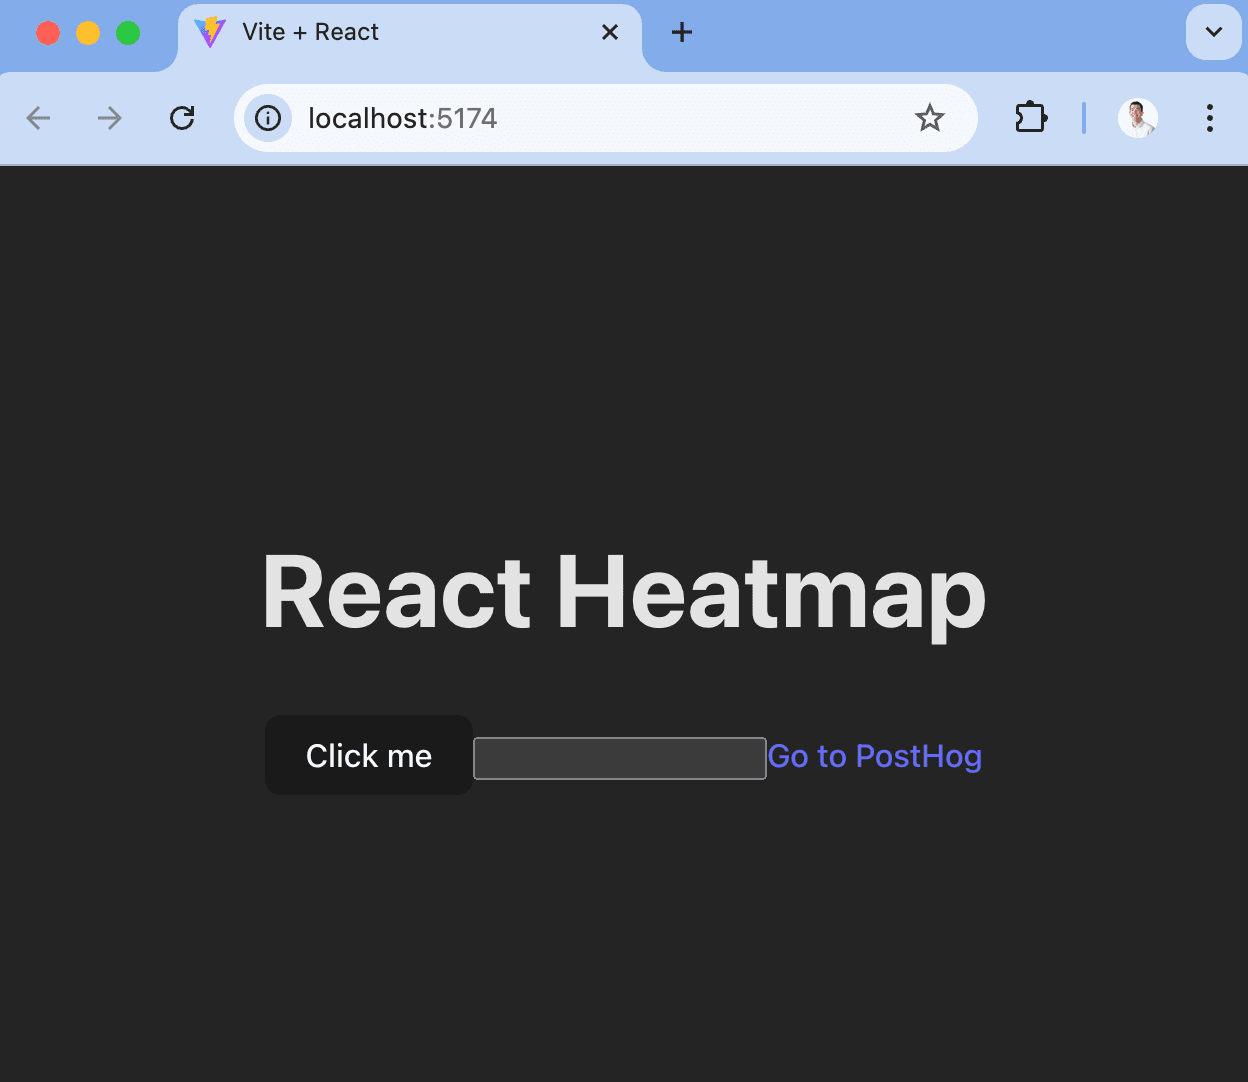
Next, in `src/App.jsx`, replace the existing code with buttons, inputs, and links we can click like this:
|
|
|
|
```jsx
|
|
// src/App.jsx
|
|
import './App.css'
|
|
|
|
function App() {
|
|
return (
|
|
<div className="App">
|
|
<h1>React Heatmap</h1>
|
|
<button>Click me</button>
|
|
<input type="text" />
|
|
<a href="https://www.posthog.com">Go to PostHog</a>
|
|
</div>
|
|
)
|
|
}
|
|
|
|
export default App
|
|
```
|
|
|
|
When we run `npm run dev`, this gives us a basic React app which we can use to test PostHog's heatmap functionality.
|
|
|
|
|
|
|
|
## Adding PostHog
|
|
|
|
Next, we will add PostHog to your React app. This requires a PostHog instance, which you can [sign up for (for free)](https://app.posthog.com/signup). Once you have a PostHog instance, go back to your terminal and install `posthog-js`:
|
|
|
|
```bash
|
|
npm i posthog-js
|
|
```
|
|
|
|
After installing, go to `src/main.jsx` and set up the PostHog provider. To do this:
|
|
|
|
1. Import `posthog` from `posthog-js` and the `PostHogProvider` from `@posthog/react`
|
|
2. Initialize `posthog` with your project API key and host from [your project settings](https://us.posthog.com/settings/project).
|
|
3. Wrap your `App` component in the `PostHogProvider` with the initialized `posthog` as a `client` property
|
|
|
|
```jsx
|
|
// src/main.jsx
|
|
import React from 'react'
|
|
import ReactDOM from 'react-dom/client'
|
|
import App from './App.jsx'
|
|
import './index.css'
|
|
import posthog from 'posthog-js'
|
|
import { PostHogProvider } from '@posthog/react'
|
|
|
|
posthog.init('<ph_project_api_key>', {
|
|
api_host: '<ph_client_api_host>',
|
|
defaults: '<ph_posthog_js_defaults>'
|
|
})
|
|
|
|
ReactDOM.createRoot(document.getElementById('root')).render(
|
|
<React.StrictMode>
|
|
<PostHogProvider client={posthog}>
|
|
<App />
|
|
</PostHogProvider>
|
|
</React.StrictMode>,
|
|
)
|
|
```
|
|
|
|
Once done, run `npm run dev` again then go to your app and click the button, enter some text into the input, and click the link. You should see events for these in your PostHog instance.
|
|
|
|
<ProductScreenshot
|
|
imageLight="https://res.cloudinary.com/dmukukwp6/image/upload/Clean_Shot_2025_03_07_at_11_05_34_2x_65b7249857.png"
|
|
imageDark="https://res.cloudinary.com/dmukukwp6/image/upload/Clean_Shot_2025_03_07_at_11_05_46_2x_8e363e9e25.png"
|
|
alt="Events in PostHog"
|
|
classes="rounded"
|
|
/>
|
|
|
|
## Launching your toolbar to access the heatmap
|
|
|
|
With our React app and PostHog set up as well as some data, we can get a heatmap of this data using the toolbar.
|
|
|
|
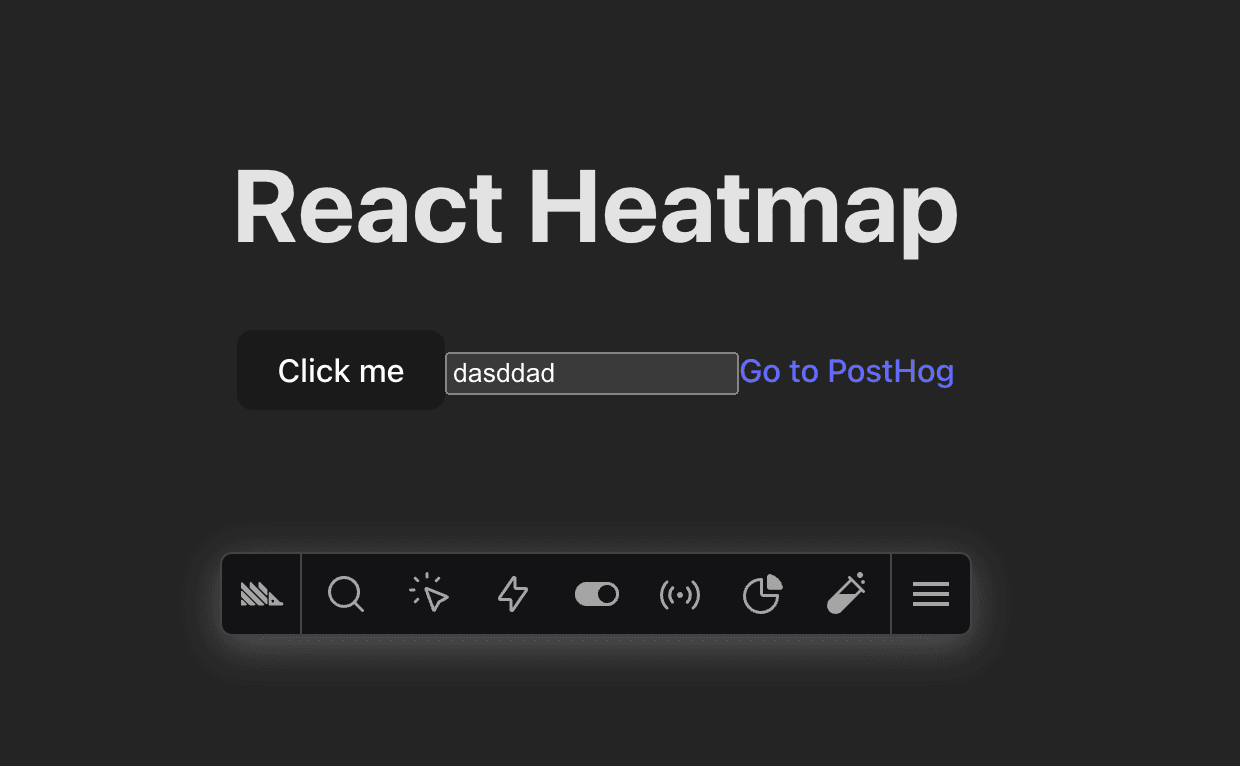
In PostHog, click the [Toolbar tab](https://us.posthog.com/toolbar) on the left menu, then add `http://localhost:5173` to the authorized URLs, and click **Launch**. This takes you to your site with the PostHog toolbar active.
|
|
|
|
|
|
|
|
To activate the heatmap, click the heatmap icon in the toolbar. This highlights the areas of your app that users are clicking on. For this tutorial, we also recommend enabling the **Clickmaps** option so you can see what elements users are clicking on.
|
|
|
|
|
|
|
|
## Understanding the heatmap
|
|
|
|
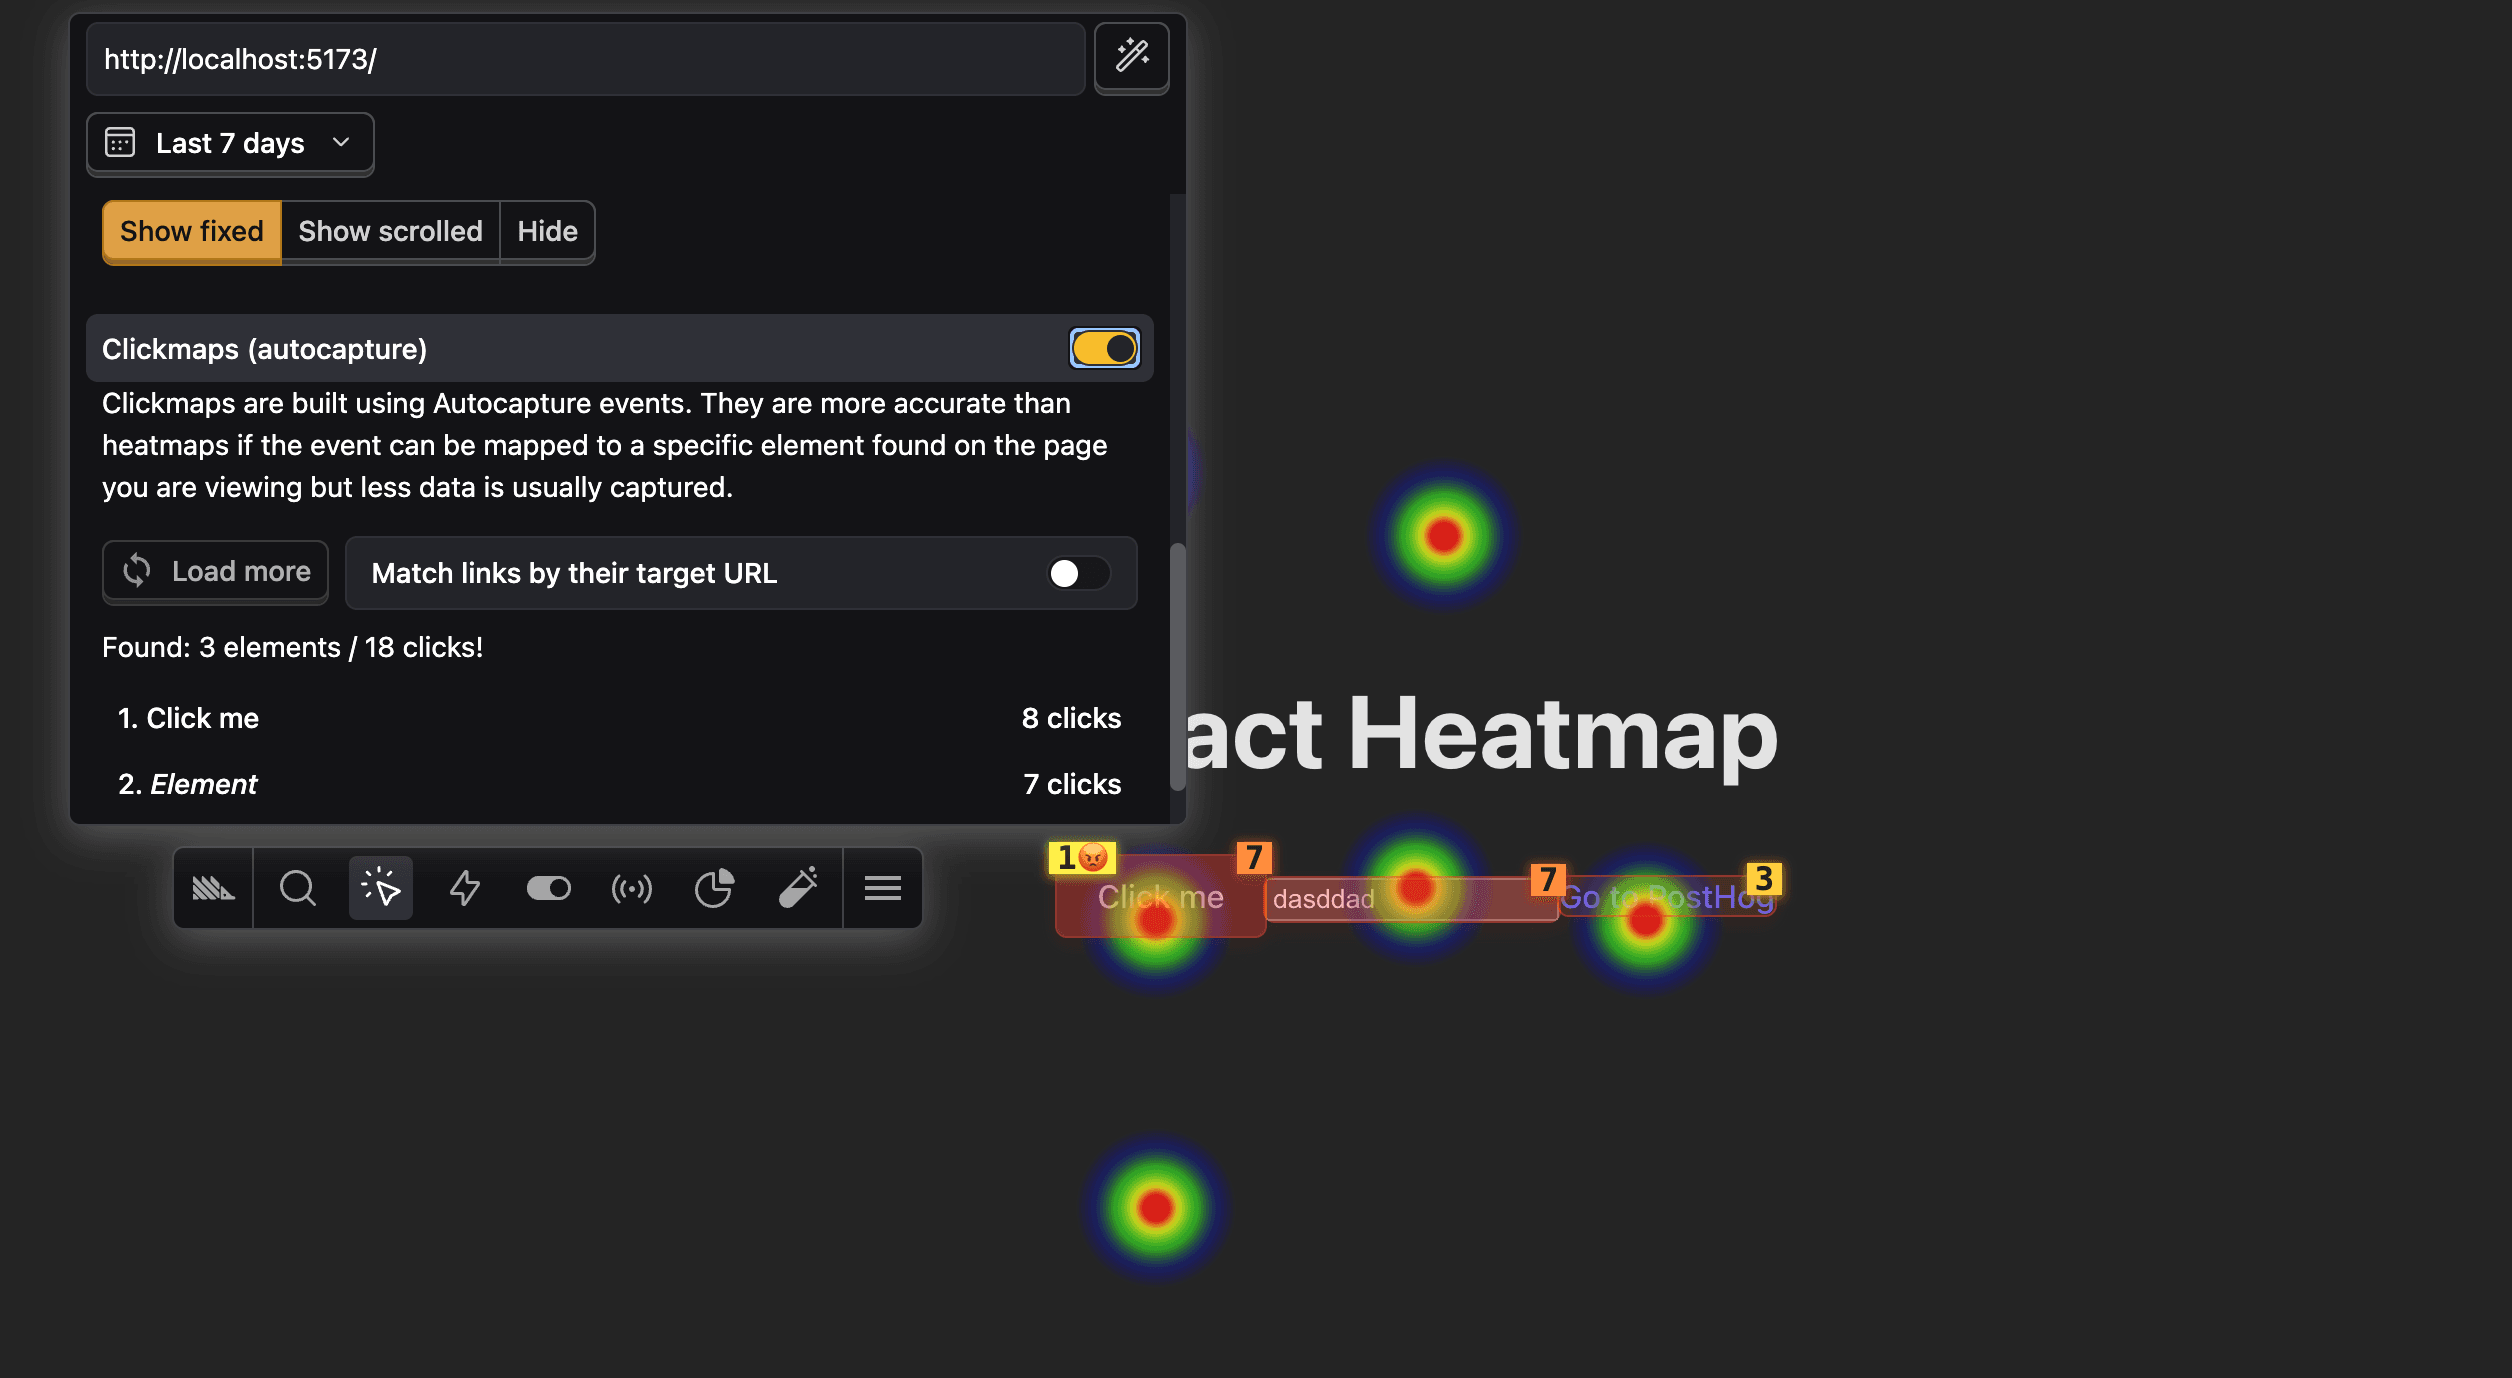
With the heatmap open, you see both hotspots and clickmaps highlighted in shades of green to red. Here's what the numbers mean:
|
|
|
|
- The numbers over the elements are how many times they were clicked over the last 7 days.
|
|
- The number next to the 😡 emoji is the number of rage clicks for that element.
|
|
|
|
When you click an element, you get a modal with different options:
|
|
|
|
1. Details about the selected option, like its text and DOM location.
|
|
2. Stats including clicks and ranking of most clicked on the page.
|
|
3. The ability to [create an action](/tutorials/how-to-capture-events-the-easy-way).
|
|
|
|
## Changing the heatmap settings
|
|
|
|
You can also change the settings for your heatmap by using the menu that appears when you click the heatmap icon. This enables you to:
|
|
|
|
- Change the events list to contain more pages using wildcards (`*`). For example, if you wanted to see the heatmap for the same elements across all blog pages, you could use `/blog/*`.
|
|
- Change the length of time the heatmap generates from. The default is 7 days.
|
|
- See all the elements in the heatmap and load more.
|
|
- Whether to aggregate by event count or unique users.
|
|
- Viewport size to include in the heatmap.
|
|
|
|
Once all these settings are set as you prefer, you've set up a heatmap for your React app. You can use it to analyze user behavior in your app.
|
|
|
|
## Further reading
|
|
|
|
- [Using the PostHog Toolbar to visualize behavior and create actions](/tutorials/toolbar)
|
|
- [How to create new events the easy way](/tutorials/how-to-capture-events-the-easy-way)
|
|
- [How to use session recordings to get a deeper understanding of user behavior](/tutorials/explore-insights-session-recordings)
|
|
|
|
<NewsletterForm />
|