mirror of
https://github.com/BillyOutlast/posthog.com.git
synced 2026-02-06 12:21:21 +01:00
91 lines
4.5 KiB
Markdown
91 lines
4.5 KiB
Markdown
---
|
||
title: 'How to do time-based breakdowns (hour, minute, real time)'
|
||
date: 2023-07-27
|
||
author:
|
||
- ian-vanagas
|
||
showTitle: true
|
||
sidebar: Docs
|
||
tags:
|
||
- sql
|
||
- insights
|
||
- product analytics
|
||
---
|
||
|
||
By default, PostHog provides an easy way to group events by week, day, and even hour. Sometimes, smaller, more specific breakdowns are required. With [SQL](/docs/sql), you can break down events by time of day, hourly, and even minute-by-minute to help you do a detailed analysis of when they happen, and this tutorial shows you how to do that.
|
||
|
||
## Time of day breakdown
|
||
|
||
We start with an easy scenario: breaking down what part of the day events take place in. To do this, we [create an insight](https://app.posthog.com/insights/new) and then break it down by checking if the event timestamp is in the morning, afternoon, evening, or night. We use a SQL `multiIf()` [expression](/docs/sql/expressions) using the hours of the day to check against `toHour(timestamp)` like so:
|
||
|
||
```sql
|
||
multiIf(
|
||
5 >= toHour(timestamp) and toHour(timestamp) < 12, 'morning',
|
||
12 >= toHour(timestamp) and toHour(timestamp) < 17, 'afternoon',
|
||
17 >= toHour(timestamp) and toHour(timestamp) < 20, 'evening',
|
||
'night'
|
||
)
|
||
```
|
||
|
||
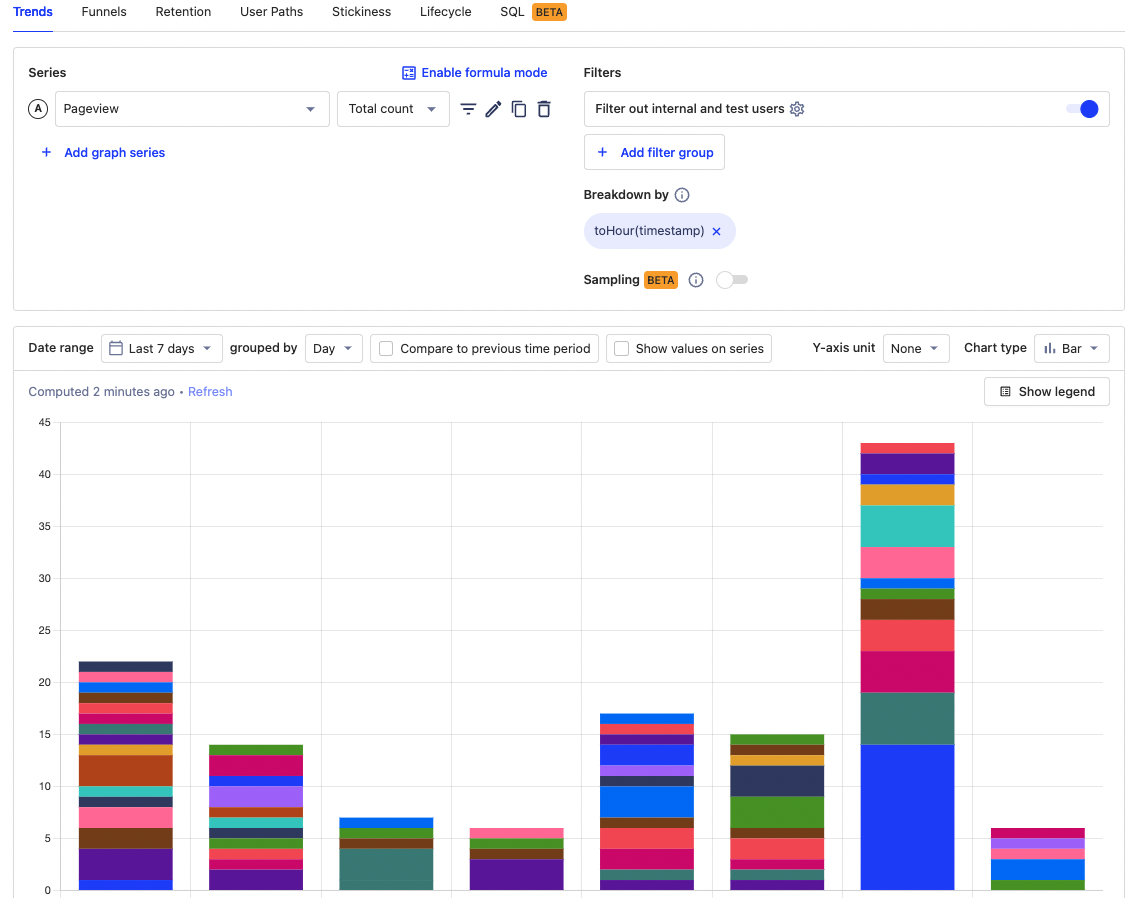
You can visualize this with a total value bar chart to the sums for the date range or time series bar to see how they change day to day.
|
||
|
||

|
||
|
||
> **Note:** Event [timestamps](/docs/data/timestamps) default to UTC. You need to adjust your times depending on your local time. For example, if you are in Pacific Daylight Time, subtract 7 hours from UTC timestamps to match your local time.
|
||
|
||
## Hourly breakdown
|
||
|
||
PostHog enables you to group data by hour for single-day date ranges. If you want to sum these values across ranges longer than one day, you can break it down by `toHour(timestamp)` and, once again, use a total value or time series bar chart to visualize.
|
||
|
||
|
||
|
||
## Minute-by-minute breakdown
|
||
|
||
If hourly isn’t enough for you, we can move down to by the minute. We use an [SQL insight](/docs/product-analytics/sql) for this. To make one, select the "SQL" tab when [creating an insight](https://app.posthog.com/insights/new). In this insight, we select a formatted count of `toStartOfMinute(timestamp)` where the timestamp is in the past day and order by the time (`minute`). In SQL, this looks like this:
|
||
|
||
```sql
|
||
select
|
||
formatDateTime(toStartOfMinute(timestamp), '%T') AS minute,
|
||
count(*)
|
||
from events
|
||
where timestamp > now() - interval 1 day
|
||
group by minute
|
||
order by minute desc
|
||
limit 100
|
||
```
|
||
|
||
If instead, you care about which minutes have the highest count, you can order by `count(*)` instead of `minute`.
|
||
|
||
```sql
|
||
select toStartOfMinute(timestamp)as minute, count(*)
|
||
from events
|
||
where timestamp > now() - interval 1 day
|
||
group by minute
|
||
order by count(*) desc
|
||
limit 100
|
||
```
|
||
|
||
Our SQL flavor also includes functions to get events for every 5, 10, and 15 minutes. To do this, replace `toStartOfMinute` with `toStartOfFiveMinutes`, `toStartOfTenMinutes`, and `toStartOfFifteenMinutes` .
|
||
|
||
## Real time filtering
|
||
|
||
Even minute-by-minute analysis might not be good enough for some people. They want a real time understanding of their analytics. To do this in PostHog, we can filter for events within a time frame. Because it takes time to ingest events into PostHog, we recommend using a 5-30 minutes filter as "real time."
|
||
|
||
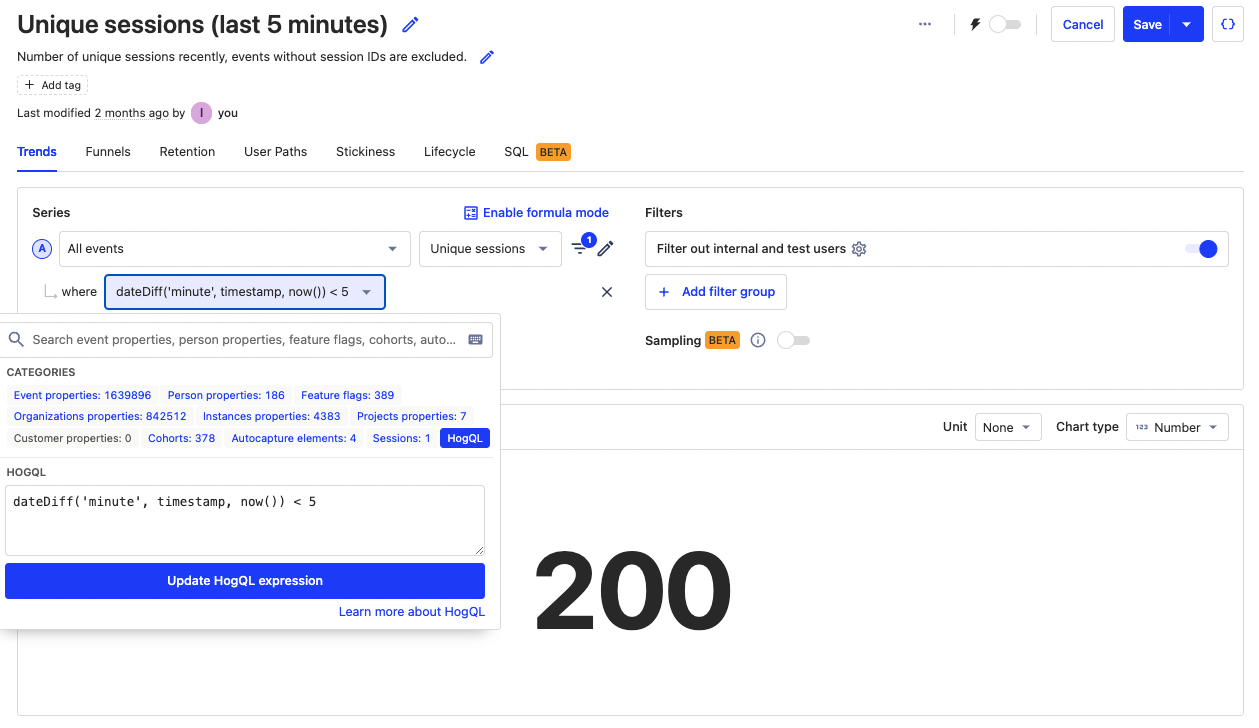
To set up one of these filters, add a filter to your series or dashboard, select **SQL expression**, then use a `dateDiff()` comparing the timestamp to the current time like this:
|
||
|
||
```sql
|
||
dateDiff('minute', timestamp, now()) < 5
|
||
```
|
||
|
||
You can use this filter on specific insights or on an entire dashboard. As example, below we use the filter to get the number of unique sessions in the last 5 minutes:
|
||
|
||
|
||
|
||
To help you get set up faster with this, you can use our [real time dashboard template](/templates/real-time-dashboard) which has basic insights and real time filters set up for you.
|
||
|
||
## Further reading
|
||
|
||
- [Using SQL for advanced time and date filters](/tutorials/hogql-date-time-filters)
|
||
- [The power of SQL’s sum() aggregation](/tutorials/hogql-sum-aggregation)
|
||
- [Using SQL for advanced breakdowns](/tutorials/hogql-breakdowns)
|
||
|
||
<NewsletterForm /> |