mirror of
https://github.com/BillyOutlast/posthog.com.git
synced 2026-02-05 11:51:21 +01:00
* Add name to QueryRequest objects (send to /query endpoint)
* Explain why using name is useful

Co-authored-by: Ian Vanagas <34755028+ivanagas@users.noreply.github.com>
492 lines
15 KiB
Markdown
492 lines
15 KiB
Markdown
---
|
||
title: How to set up embedded analytics
|
||
date: 2025-08-29
|
||
author:
|
||
- ian-vanagas
|
||
tags:
|
||
- insights
|
||
- product analytics
|
||
- sql
|
||
---
|
||
|
||
If you're building a B2B2C product, *your users* might want analytics about *their users*. You can provide this with embedded analytics (AKA customer-facing analytics), events you capture and then display for them.
|
||
|
||
This tutorial shows you how to set up embedded analytics by creating a basic Next.js app with PostHog, querying analytics data via PostHog's [queries API](/docs/api/queries), and then displaying it with Recharts.
|
||
|
||
> **Note:** In this tutorial, we include a `name` parameter with each query. This makes it easier to identify and debug queries in the [query log](/docs/data/query-log), which is especially useful when building customer-facing analytics.
|
||
|
||
## Creating a Next.js app
|
||
|
||
First, ensure [Node.js is installed](https://nodejs.dev/en/learn/how-to-install-nodejs/) (version 18.0 or newer) then run the following to create a new Next.js app. Say **yes** to TypeScript, **yes** to Tailwind, **yes** to app router, and the defaults for all the other options.
|
||
|
||
```bash
|
||
npx create-next-app@latest embedded-analytics
|
||
```
|
||
|
||
We’ll then update `page.tsx` to an input to select between two “teams” and a button. We’ll use this to capture data later.
|
||
|
||
```ts
|
||
// app/page.tsx
|
||
'use client'
|
||
import { useState } from 'react'
|
||
|
||
export default function Home() {
|
||
const [team, setTeam] = useState('blue')
|
||
|
||
return (
|
||
<div className="flex flex-col items-center justify-center h-screen">
|
||
<h1 className="text-4xl font-bold">Welcome to the app</h1>
|
||
<select
|
||
value={team}
|
||
onChange={(e) => setTeam(e.target.value)}
|
||
className="mb-4 p-2 border rounded-md"
|
||
>
|
||
<option value="blue">Blue Team</option>
|
||
<option value="red">Red Team</option>
|
||
</select>
|
||
<button className="bg-blue-500 text-white p-2 rounded-md hover:bg-blue-600" onClick={() => {
|
||
console.log("clicked");
|
||
}}>Click me</button>
|
||
|
||
</div>
|
||
);
|
||
}
|
||
```
|
||
|
||
## Setting up PostHog
|
||
|
||
To capture analytics for our app, start by installing `posthog-js`:
|
||
|
||
```bash
|
||
npm i posthog-js
|
||
```
|
||
|
||
Afterwards, create an `instrumentation-client.ts` file at the base of your project and set up a PostHog initialization in it using your project API key and host from [your project settings](http://app.posthog.com/settings/project).
|
||
|
||
```ts
|
||
// instrumentation-client.ts
|
||
import posthog from 'posthog-js'
|
||
|
||
posthog.init('<ph_project_api_key>', {
|
||
api_host: '<ph_api_host>',
|
||
defaults: '<ph_posthog_js_defaults>',
|
||
});
|
||
```
|
||
|
||
To use it, import PostHog in `page.tsx` and capture a `home_button_clicked` event like this:
|
||
|
||
```ts
|
||
// app/page.tsx
|
||
'use client'
|
||
import { useState } from 'react'
|
||
import posthog from 'posthog-js' // +
|
||
|
||
export default function Home() {
|
||
const [team, setTeam] = useState('blue')
|
||
|
||
return (
|
||
<div className="flex flex-col items-center justify-center h-screen">
|
||
<h1 className="text-4xl font-bold">Welcome to the app</h1>
|
||
<select
|
||
value={team}
|
||
onChange={(e) => setTeam(e.target.value)}
|
||
className="mb-4 p-2 border rounded-md"
|
||
>
|
||
<option value="blue">Blue Team</option>
|
||
<option value="red">Red Team</option>
|
||
</select>
|
||
<button className="bg-blue-500 text-white p-2 rounded-md hover:bg-blue-600" onClick={() => {
|
||
posthog.capture('home_button_clicked', { // +
|
||
team: team, // +
|
||
}) // +
|
||
}}>Click me</button>
|
||
</div>
|
||
);
|
||
}
|
||
```
|
||
|
||
You can then run `npm run dev` to see the app in action. PostHog will autocapture events and clicking the button will capture a `home_button_clicked` event with a team property.
|
||
|
||
<ProductScreenshot
|
||
imageLight="https://res.cloudinary.com/dmukukwp6/image/upload/Clean_Shot_2025_03_26_at_13_46_17_2x_e517d993d6.png"
|
||
imageDark="https://res.cloudinary.com/dmukukwp6/image/upload/Clean_Shot_2025_03_26_at_13_46_40_2x_66514bd060.png"
|
||
alt="PostHog"
|
||
classes="rounded"
|
||
/>
|
||
|
||
## Querying data from PostHog for our embedded analytics
|
||
|
||
Now that we have data being captured, we can set up our queries to get this data from PostHog. We’ll create two:
|
||
|
||
1. A trend of pageviews
|
||
2. A count of button clicks that depends on each team
|
||
|
||
This starts by creating API routes in our app to make both PostHog queries. In our `app` folder, we’ll create a new `api` folder, then create `pageviews` and `button-clicks` folders inside that, and then a `route.ts` file inside each of those.
|
||
|
||
### Setting up our pageviews query
|
||
|
||
In `/api/pageviews/route.ts`, we start by setting our host URL and project ID, both of which you can get from the URL of your PostHog instance.
|
||
|
||
It also requires a personal API key with project **query read** permissions. You can set this up in [your user settings](https://app.posthog.com/settings/user-api-keys).
|
||
|
||
We then use these to set up a request to PostHog’s `query` endpoint with an SQL query to get pageviews for the last 7 days. Together, this looks like this:
|
||
|
||
```ts
|
||
// app/api/pageviews/route.ts
|
||
import { NextRequest, NextResponse } from 'next/server';
|
||
|
||
export async function POST(request: NextRequest) {
|
||
|
||
const posthogUrl = "https://us.posthog.com" // or eu...
|
||
const projectId = "5...."
|
||
const personalApiKey = "phx_1..."
|
||
|
||
try {
|
||
const url = `${posthogUrl}/api/projects/${projectId}/query/`;
|
||
|
||
const response = await fetch(url, {
|
||
method: 'POST',
|
||
headers: {
|
||
'Content-Type': 'application/json',
|
||
'Authorization': `Bearer ${personalApiKey}`
|
||
},
|
||
body: JSON.stringify({
|
||
query: {
|
||
kind: 'HogQLQuery',
|
||
query: `
|
||
SELECT
|
||
toDate(timestamp) AS date,
|
||
count() AS pageviews
|
||
FROM events
|
||
WHERE
|
||
event = '$pageview'
|
||
GROUP BY date
|
||
ORDER BY date DESC
|
||
LIMIT 7
|
||
`
|
||
},
|
||
name: 'embedded_analytics_pageviews'
|
||
}),
|
||
});
|
||
|
||
if (!response.ok) {
|
||
const errorText = await response.text();
|
||
return NextResponse.json(
|
||
{ error: `PostHog API error: ${errorText}` },
|
||
{ status: response.status }
|
||
);
|
||
}
|
||
|
||
const data = await response.json();
|
||
|
||
return NextResponse.json(data.results);
|
||
|
||
} catch (error) {
|
||
console.error('Error processing pageviews request:', error);
|
||
return NextResponse.json(
|
||
{ error: 'Internal server error' },
|
||
{ status: 500 }
|
||
);
|
||
}
|
||
}
|
||
```
|
||
|
||
### Setting up our button clicks query
|
||
|
||
In `/api/button-clicks/route.ts`, we’ll add a similar API request to get button clicks. The difference is that it takes a variable for the team we use to get the button clicks for that specific team.
|
||
|
||
```ts
|
||
// app/api/button-clicks/route.ts
|
||
import { NextRequest, NextResponse } from 'next/server';
|
||
|
||
export async function POST(request: NextRequest) {
|
||
|
||
const posthogUrl = "https://us.posthog.com" // or eu...
|
||
const projectId = "5...."
|
||
const personalApiKey = "phx_1..."
|
||
|
||
try {
|
||
const url = `${posthogUrl}/api/projects/${projectId}/query/`;
|
||
|
||
const body = await request.json();
|
||
// Make sure to sanitize this value in a real implementation
|
||
const team = body.team;
|
||
|
||
const response = await fetch(url, {
|
||
method: 'POST',
|
||
headers: {
|
||
'Content-Type': 'application/json',
|
||
'Authorization': `Bearer ${personalApiKey}`
|
||
},
|
||
body: JSON.stringify({
|
||
query: {
|
||
kind: 'HogQLQuery',
|
||
query: `
|
||
select count()
|
||
from events
|
||
where
|
||
event = 'home_button_clicked'
|
||
AND toDate(timestamp) = today()
|
||
AND properties.team = '${team}'
|
||
|
||
`
|
||
},
|
||
name: `embedded_analytics_button_clicks`
|
||
}),
|
||
});
|
||
|
||
if (!response.ok) {
|
||
const errorText = await response.text();
|
||
return NextResponse.json(
|
||
{ error: `PostHog API error: ${errorText}` },
|
||
{ status: response.status }
|
||
);
|
||
}
|
||
|
||
const data = await response.json();
|
||
|
||
return NextResponse.json(data.results);
|
||
|
||
} catch (error) {
|
||
console.error('Error processing pageviews request:', error);
|
||
return NextResponse.json(
|
||
{ error: 'Internal server error' },
|
||
{ status: 500 }
|
||
);
|
||
}
|
||
}
|
||
```
|
||
|
||
### Triggering analytics queries
|
||
|
||
The last piece here is triggering these queries and showing the data to the frontend.
|
||
|
||
To do this, we will create a new `analytics` folder inside the `app` directory. In it, we’ll create a `page.tsx` file. This page makes requests to both the `/api/pageviews` and `/api/button-click` routes and displays the returned data.
|
||
|
||
It also formats the pageview data for use in a trend and lets people choose between `red` and `blue` team button click stats. Altogether, this looks like this:
|
||
|
||
```ts
|
||
// app/analytics/page.tsx
|
||
'use client'
|
||
import React, { useState, useEffect } from 'react';
|
||
|
||
export default function AnalyticsPage() {
|
||
const [pageviews, setPageviews] = useState<Array<{date: string, views: number}>>([]);
|
||
const [buttonClicks, setButtonClicks] = useState('');
|
||
const [team, setTeam] = useState('blue');
|
||
|
||
const fetchPageviews = async () => {
|
||
try {
|
||
const res = await fetch('/api/pageviews', {
|
||
method: 'POST',
|
||
headers: {
|
||
'Content-Type': 'application/json',
|
||
}
|
||
})
|
||
const response = await res.json();
|
||
const formattedData = response.map(([date, views]: [string, number]) => ({
|
||
date,
|
||
views
|
||
}));
|
||
|
||
setPageviews(formattedData);
|
||
} catch (error: any) {
|
||
console.error('Error fetching pageviews:', error);
|
||
setPageviews([]);
|
||
}
|
||
};
|
||
|
||
const fetchButtonClicks = async (team: string) => {
|
||
try {
|
||
setButtonClicks('Getting button clicks...');
|
||
|
||
const res = await fetch('/api/button-clicks', {
|
||
method: 'POST',
|
||
headers: {
|
||
'Content-Type': 'application/json',
|
||
},
|
||
body: JSON.stringify({ team: team }),
|
||
})
|
||
const response = await res.json();
|
||
|
||
setButtonClicks(response);
|
||
} catch (error: any) {
|
||
setButtonClicks(error.message);
|
||
}
|
||
};
|
||
|
||
const changeTeam = (e: any) => {
|
||
setTeam(e.target.value);
|
||
fetchButtonClicks(e.target.value);
|
||
}
|
||
|
||
useEffect(() => {
|
||
fetchPageviews();
|
||
fetchButtonClicks(team);
|
||
}, []);
|
||
|
||
return (
|
||
<div className="flex flex-col items-center justify-center min-h-screen gap-5">
|
||
<label>Pageviews:</label>
|
||
<div className="space-y-2">
|
||
{Array.isArray(pageviews) ? (
|
||
pageviews.map((day) => (
|
||
<div key={day.date} className="flex gap-4">
|
||
<span>{day.date}:</span>
|
||
<span>{day.views} views</span>
|
||
</div>
|
||
))
|
||
) : (<div>Loading...</div>)
|
||
}
|
||
</div>
|
||
|
||
<select
|
||
value={team}
|
||
onChange={(e) => changeTeam(e)}
|
||
className="mb-4 p-2 border rounded-md"
|
||
>
|
||
<option value="blue">Blue Team</option>
|
||
<option value="red">Red Team</option>
|
||
</select>
|
||
|
||
<label>Button {team} team clicks:</label>
|
||
<label>{buttonClicks}</label>
|
||
|
||
</div>
|
||
);
|
||
};
|
||
```
|
||
|
||
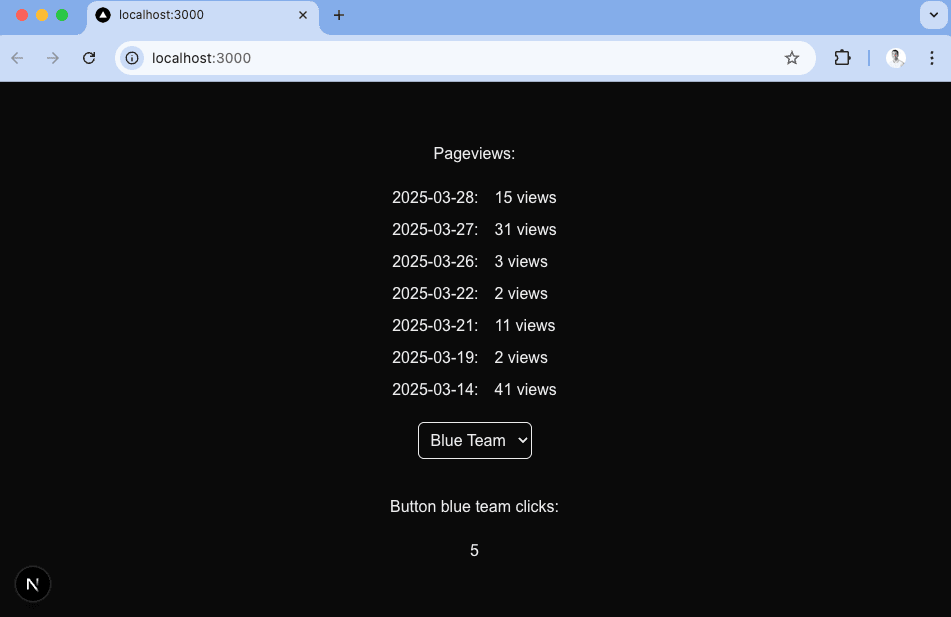
When we run `npm run dev` again and go to `http://localhost:3000/analytics`, we’ll see our pageview and button click data from PostHog.
|
||
|
||
|
||
|
||
Toggling between the two team’s button clicks gives you an idea of how you can segment embedded analytics for multiple teams or users.
|
||
|
||
The next problem we need to solve: making the pageview data look better. We’ll set up better visuals in the next step with Recharts.
|
||
|
||
## Setting up Recharts to visualize PostHog data
|
||
|
||
The simplest way to visualize our data is with Recharts, but you could also use a library like shadcn or Tremor. To start with Recharts, install it:
|
||
|
||
```bash
|
||
npm i recharts
|
||
```
|
||
|
||
Next, in `app/analytics/page.tsx`, we’ll import the components needed for a line chart and set it up with our formatted pageview data like this:
|
||
|
||
```ts
|
||
// app/analytics/page.tsx
|
||
'use client'
|
||
import React, { useState, useEffect } from 'react';
|
||
import { LineChart, Line, XAxis, YAxis, Tooltip } from 'recharts'; // +
|
||
|
||
export default function AnalyticsPage() {
|
||
// ... existing code
|
||
|
||
return (
|
||
<div className="flex flex-col items-center justify-center min-h-screen gap-5">
|
||
<label>Pageviews:</label>
|
||
{pageviews.length > 0 && ( // +
|
||
<LineChart width={800} height={400} data={pageviews}> // +
|
||
<Line type="monotone" dataKey="views" stroke="#8884d8" /> // +
|
||
<XAxis dataKey="date" /> // +
|
||
<YAxis /> // +
|
||
<Tooltip /> // +
|
||
</LineChart> // +
|
||
)} // +
|
||
{/* ... existing code */}
|
||
</div>
|
||
);
|
||
};
|
||
```
|
||
|
||
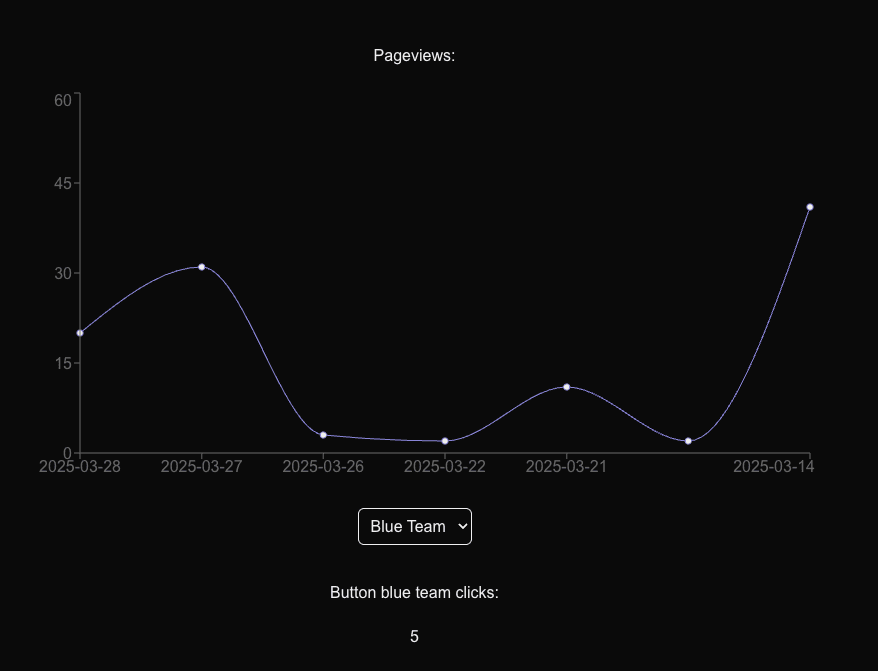
This creates a simple (and much nicer looking) final visualization for our pageview data.
|
||
|
||
|
||
|
||
## Using a materialized view to improve performance
|
||
|
||
Although these queries are simple and fast, more complex queries you add later may be slower. To improve performance and keep queries as fast as possible, you can use a [materialized view](/docs/data-warehouse/views/materialize).
|
||
|
||
We can show this off by materializing our pageview query. To do this, go to the SQL editor in PostHog and enter your pageview query:
|
||
|
||
```sql
|
||
SELECT
|
||
toDate(timestamp) AS date,
|
||
count() AS pageviews
|
||
FROM events
|
||
WHERE
|
||
event = '$pageview'
|
||
GROUP BY date
|
||
ORDER BY date DESC
|
||
LIMIT 7
|
||
```
|
||
|
||
Select the **Materialization** tab below the query and click **Save and materialize**. Give your view a name like `mat_embedded_pageviews`, press **Submit**, and then the materialization will start.
|
||
|
||
<ProductScreenshot
|
||
imageLight="https://res.cloudinary.com/dmukukwp6/image/upload/w_1600,c_limit,q_auto,f_auto/Clean_Shot_2025_08_29_at_11_48_18_2x_6e82125b07.png"
|
||
imageDark="https://res.cloudinary.com/dmukukwp6/image/upload/w_1600,c_limit,q_auto,f_auto/Clean_Shot_2025_08_29_at_11_47_58_2x_e9c15e9a5c.png"
|
||
alt="Materialization"
|
||
classes="rounded"
|
||
/>
|
||
|
||
Once done, you can then use the materialized view back in your pageview API route like this:
|
||
|
||
```ts focusOnLines=18-21
|
||
import { NextRequest, NextResponse } from 'next/server';
|
||
|
||
export async function POST(request: NextRequest) {
|
||
|
||
const posthogUrl = "https://us.posthog.com" // or eu...
|
||
const projectId = "5...."
|
||
const personalApiKey = "phx_1..."
|
||
|
||
try {
|
||
const url = `${posthogUrl}/api/projects/${projectId}/query/`;
|
||
|
||
const response = await fetch(url, {
|
||
method: 'POST',
|
||
headers: {
|
||
'Content-Type': 'application/json',
|
||
'Authorization': `Bearer ${personalApiKey}`
|
||
},
|
||
body: JSON.stringify({
|
||
query: {
|
||
kind: 'HogQLQuery',
|
||
query: `SELECT * from mat_embedded_pageviews`
|
||
}
|
||
}),
|
||
});
|
||
|
||
if (!response.ok) {
|
||
const errorText = await response.text();
|
||
return NextResponse.json(
|
||
{ error: `PostHog API error: ${errorText}` },
|
||
{ status: response.status }
|
||
);
|
||
}
|
||
|
||
const data = await response.json();
|
||
|
||
return NextResponse.json(data.results);
|
||
|
||
} catch (error) {
|
||
console.error('Error processing pageviews request:', error);
|
||
return NextResponse.json(
|
||
{ error: 'Internal server error' },
|
||
{ status: 500 }
|
||
);
|
||
}
|
||
}
|
||
```
|
||
|
||
The response is the same as before but the query is faster, which helps provide a better experience for your users.
|
||
|
||
## Further reading
|
||
|
||
- [How to use Recharts to visualize analytics data (with examples)](/tutorials/recharts)
|
||
- [How to use React Charts to visualize analytics data (with examples)](/tutorials/react-charts)
|
||
- [The basics of SQL for analytics](/product-engineers/sql-for-analytics)
|